

Category
Agentes de IA
Share the article
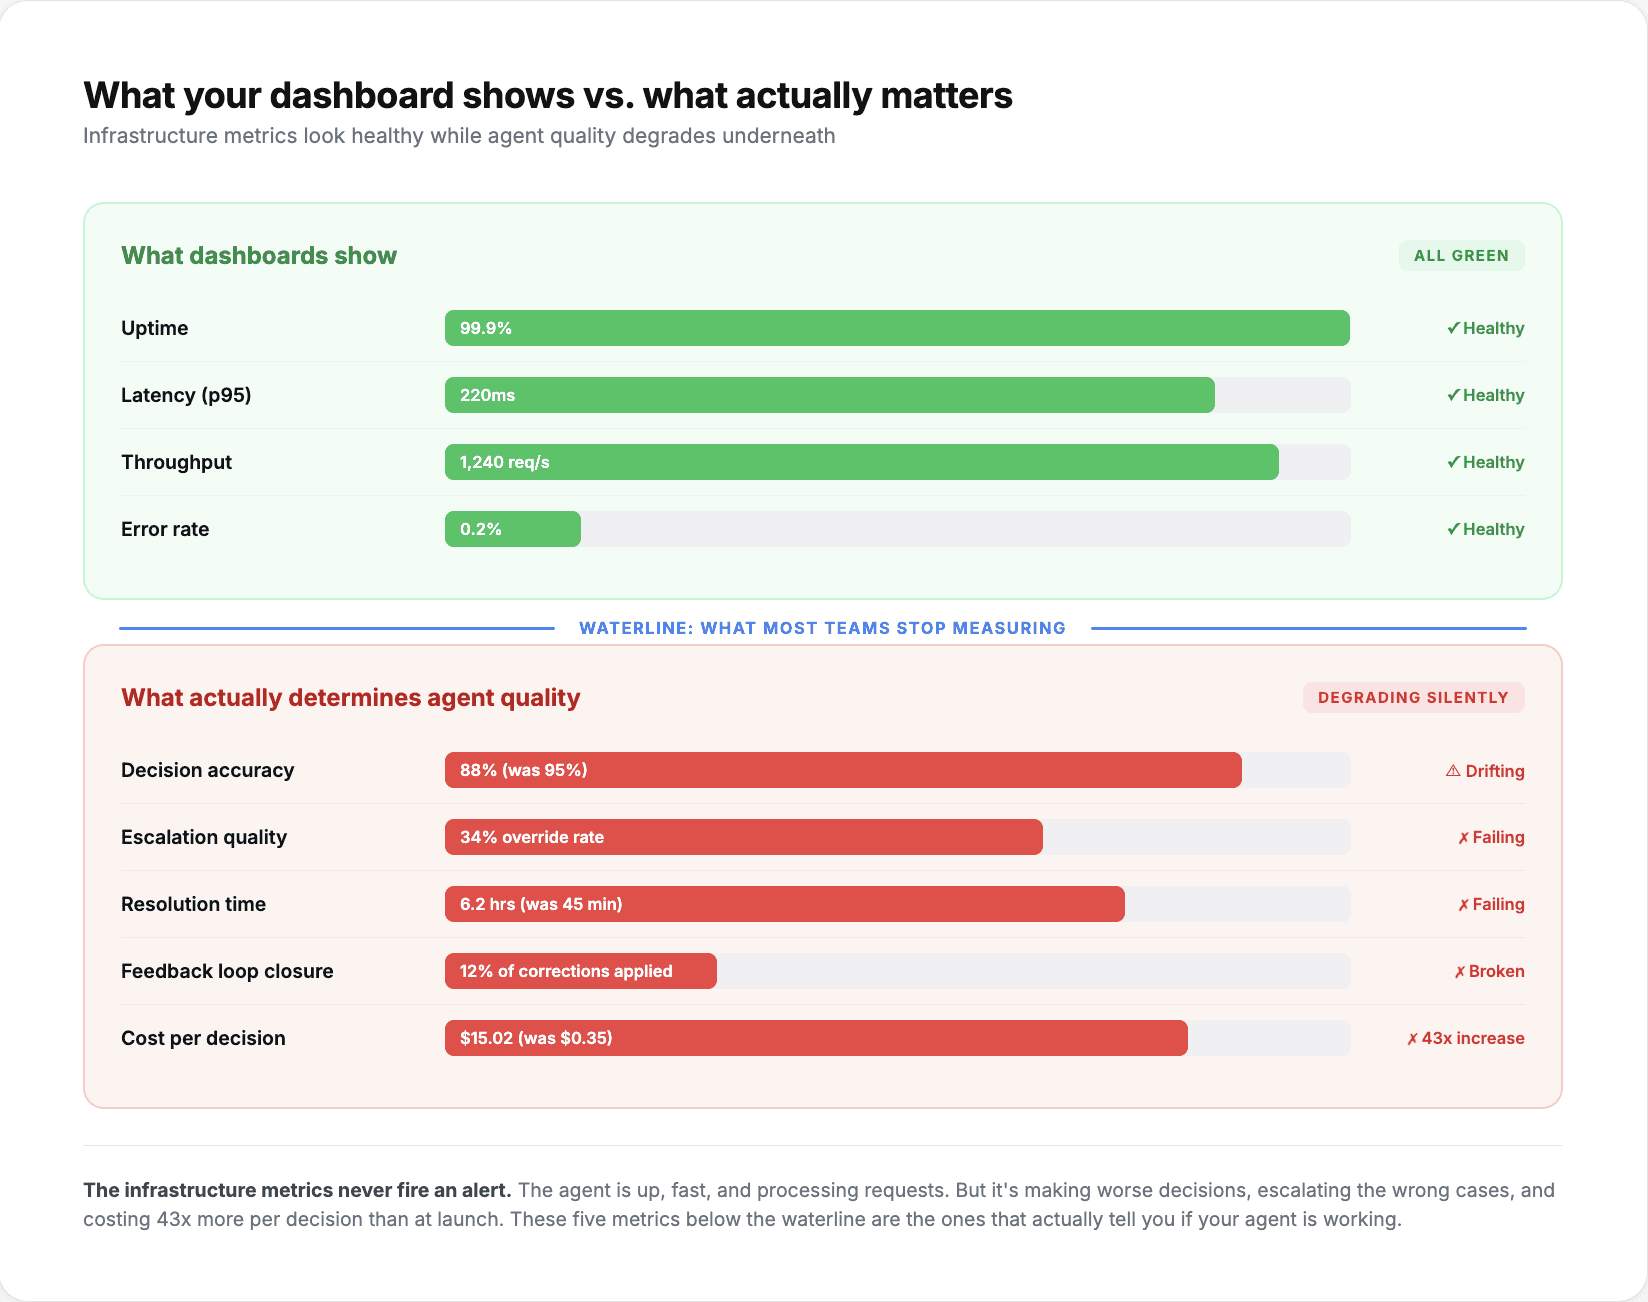
An AI agent can report 99.9% uptime and still be wrong half the time. That is the fundamental problem with monitoring AI agents the same way you monitor traditional software.
Infrastructure metrics, uptime, latency, error rates, throughput, tell you whether the agent is running. They do not tell you whether it is running well. A claims processing agent that auto-approves every submission is technically operational. It is also hemorrhaging money. A KYC verification agent that flags 70% of applications for manual review is never going to "go down," but it is also not doing its job.
Production AI agent teams that scale past the pilot stage track a different set of metrics. These five are the ones most teams add after their first production incident teaches them that uptime is not enough.
1. Decision accuracy over time (not just at launch)
Most teams measure accuracy during testing and at launch. Few measure it continuously in production. This is the metric that catches the most common failure mode: gradual degradation.
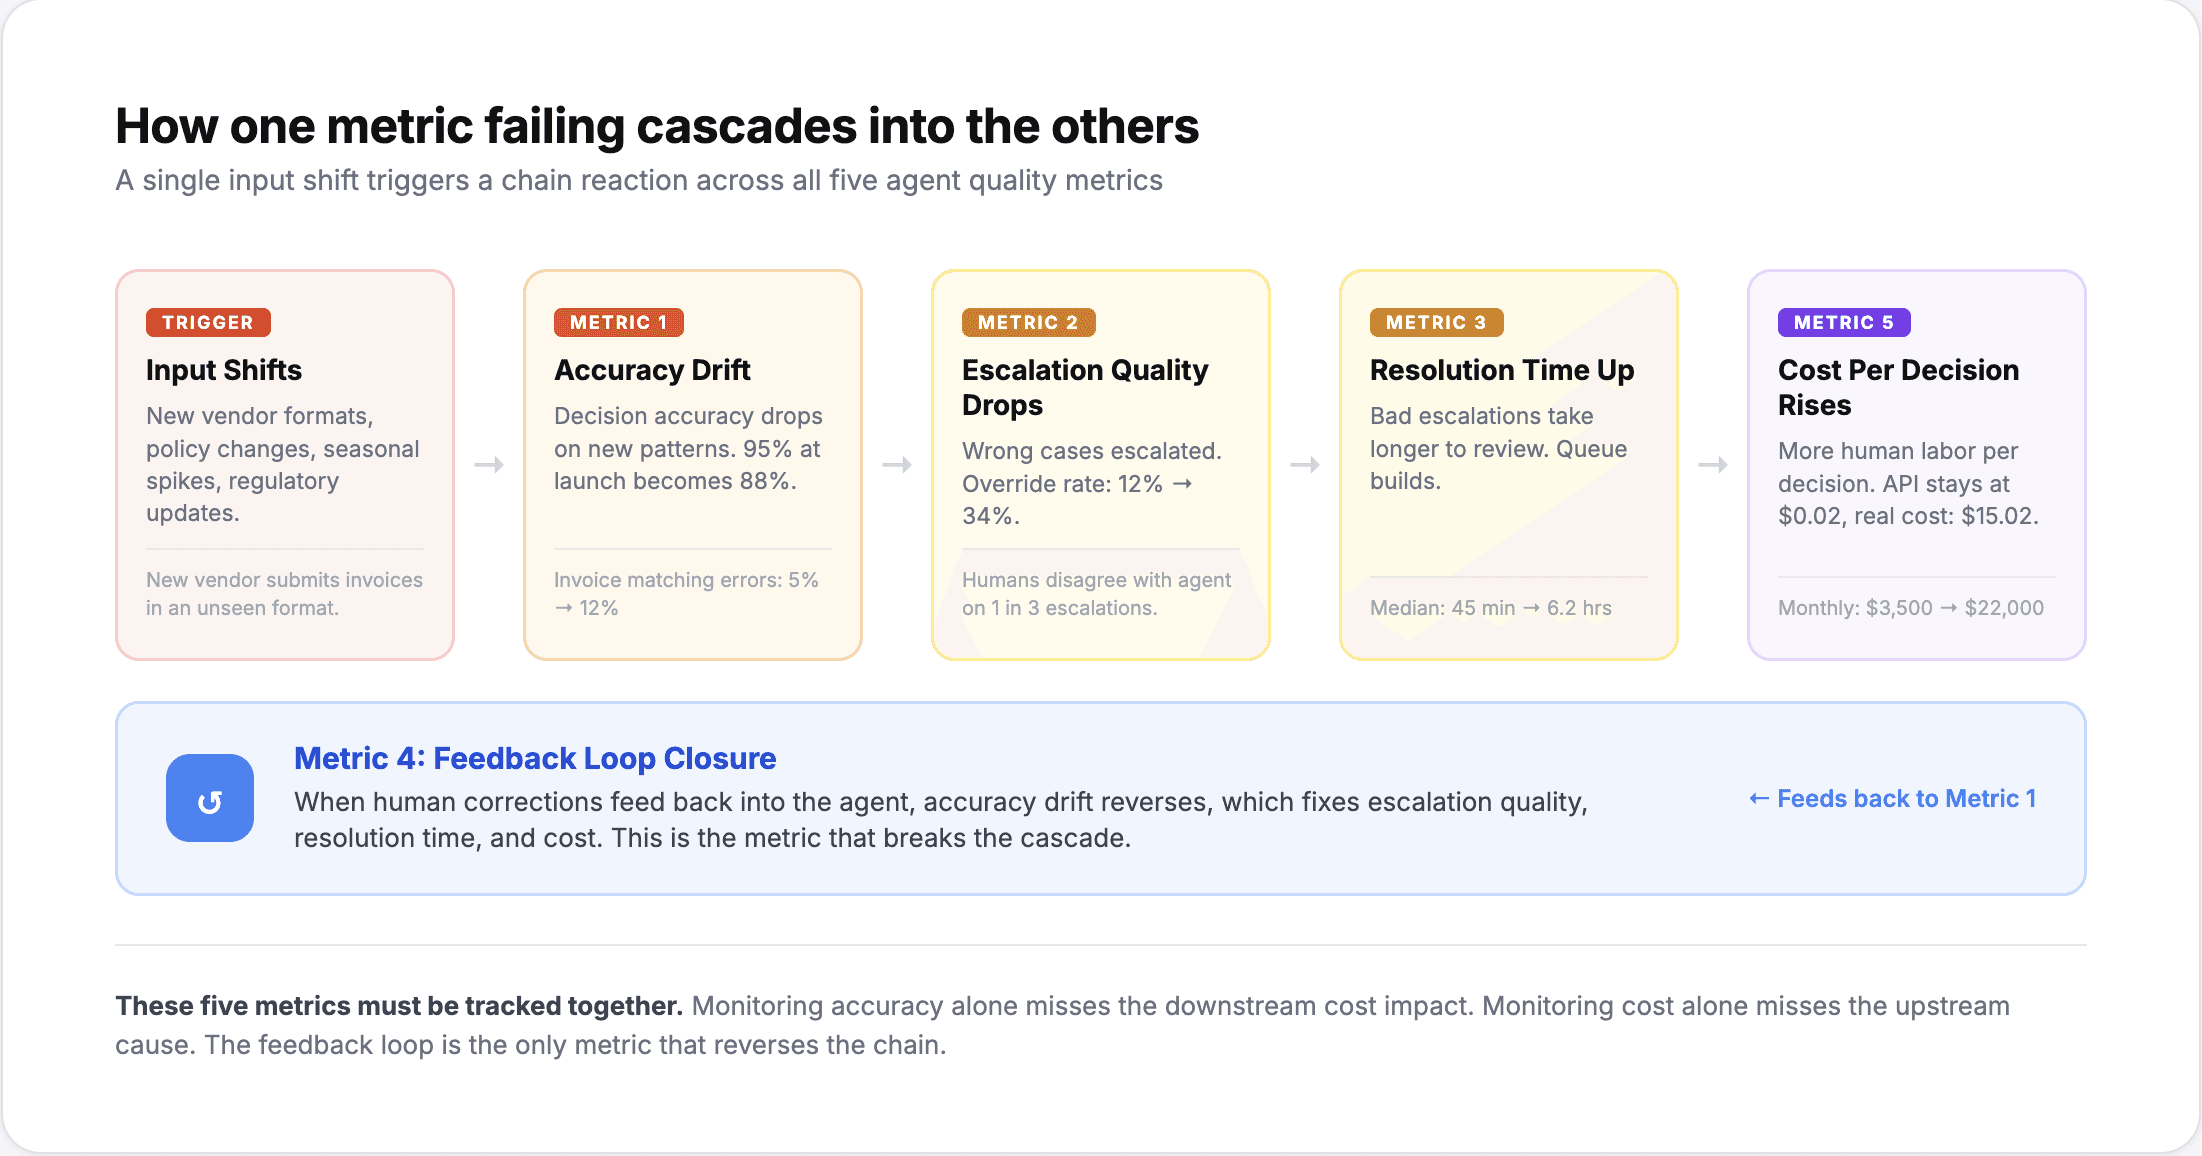
An agent that launches at 95% accuracy on invoice matching might be at 88% three months later. Not because the model degraded, but because the input distribution shifted. A new vendor started submitting invoices in a different format. A policy change introduced a new approval workflow the agent was not trained on. Seasonal patterns created transaction volumes outside the training range.
The fix is straightforward: sample agent decisions at regular intervals, compare them against human-reviewed ground truth, and track the accuracy trendline. Platforms with self-learning capabilities) automate this feedback loop. A European neo-bank running KYC agents maintains accuracy at 95.7% because the system continuously adapts to new document types and regulatory variations rather than waiting for a manual model refresh.
What to track: Weekly accuracy rate by workflow. Alert when accuracy drops more than 3 percentage points below the 30-day average. Segment by input type if possible, because aggregate accuracy can mask category-specific degradation.
2. Escalation quality (not just escalation rate)
Escalation rate tells you how many decisions the agent passed to a human. Escalation quality tells you whether those escalations were warranted.
There are two failure modes. Under-escalation means the agent is making decisions it should not be making. Over-escalation means the agent is pushing routine work back to humans, which defeats the purpose of deploying it. Most teams track the overall escalation rate (e.g., "our agent escalates 12% of claims"). Very few track what happens after escalation.
The metric that matters is the human override rate on escalated decisions. If an agent escalates a claim and recommends denial, and the adjuster reviews it and also denies it, the escalation was correct. If the adjuster reverses the recommendation 40% of the time, the agent's escalation criteria need adjustment.
Enterprise deployments processing 10 million+ tasks track this at the workflow level. A well-tuned agent should have an override rate below 15% on escalated decisions. Above 25% means the escalation logic needs retraining, not just threshold adjustment.
What to track: Override rate on escalated decisions, segmented by workflow and escalation reason. Alert when override rate exceeds 20% for any single escalation category.
3. Time-to-resolution including human steps
End-to-end processing time is the metric that exposes hidden bottlenecks in the human-agent workflow.
Teams often measure agent processing time in isolation: "the agent processes an invoice in 4 seconds." But the actual time from submission to resolution might be 6 hours because the agent escalated it, the escalation sat in a queue for 3 hours, a human reviewed it in 12 minutes, and the resolution notification took another 2 hours due to a batch process.
Agent speed is irrelevant if the overall workflow is slow. The metric that matters is time-to-resolution measured from the moment a task enters the system to the moment it is completed, including all human steps, queue times, and downstream processes.
Insurance teams that reduced claims processing from 60 days to 3 days did not achieve that by making the agent faster. They achieved it by redesigning the workflow so that agent-handled claims skip the manual queue entirely, and escalated claims arrive with enough context that human review takes minutes instead of hours.
What to track: Median time-to-resolution by workflow, broken into: agent processing time, queue/wait time, human review time, downstream processing time. Alert when median time-to-resolution increases by more than 20% week over week.
4. Feedback loop closure rate
When a human corrects an agent's decision, does that correction improve future decisions? This is the metric that separates agents that learn from agents that repeat mistakes.
In systems without feedback loops, a human override is a one-time fix. The agent will make the same error on similar inputs next time. In systems with feedback loops, each correction is a training signal. Over time, the error rate on that specific pattern drops. The question is: how quickly?
Feedback loop closure rate measures the percentage of human corrections that result in measurable accuracy improvement within a defined time window. If an adjuster corrects an agent's decision on a specific type of motor claim, and the agent's accuracy on that claim type improves within 30 days, the loop is closed.
Deployments with active self-learning mechanisms, like the neo-bank that reached 95.7% KYC accuracy through iterative tuning, typically show 70-85% feedback loop closure within 30 days. Systems without active learning show 0%, because corrections are not being fed back into the model at all. Teams relying on quarterly model refreshes see closure rates of 20-30%, with months of lag between correction and improvement.
What to track: Percentage of human overrides that lead to measurable accuracy improvement within 30 days. Segment by correction type to identify which error patterns the system is and is not learning from.
5. Cost per decision (not just cost per API call)
The most misleading metric in agent deployment is cost per API call. It tells you the infrastructure cost of running the model but ignores everything else.
Cost per decision includes: the API/inference cost, the data retrieval cost (pulling records from ERPs, databases, APIs), the human review cost for escalated decisions, and the error correction cost when the agent gets it wrong. A decision that costs $0.02 in API calls but triggers a $50 manual review 30% of the time actually costs $15.02 per decision on average.
Enterprise teams running financial operations at scale report that reducing human intervention by 60-80% in the first month translates to cost-per-decision reductions of 70-90%. But the savings only materialize if escalation rates stay low and accuracy stays high. A cheaper model that escalates more often can cost more per decision than a more expensive model that resolves more autonomously.
What to track: Fully loaded cost per decision, including human labor on escalations and error corrections. Compare against the pre-agent cost per decision for the same workflow. Alert if cost per decision increases month over month, which usually signals rising escalation rates or accuracy degradation.
Building a production monitoring practice
These five metrics share a common theme: they measure whether the agent is doing its job correctly, not just whether it is running.
The practical implementation is to add these metrics as a second layer on top of your existing infrastructure monitoring. Keep tracking uptime, latency, and error rates. They catch outages and performance regressions. Then add the five metrics above to catch the failures that infrastructure monitoring cannot see.
Most enterprise agent platforms provide dashboards for accuracy tracking, escalation analysis, and cost accounting. If your platform does not, the minimum viable version is a weekly manual review: sample 50 agent decisions, compare against human judgment, calculate the override rate on that week's escalations, and trend the results.
The teams that monitor well are the teams that keep their agents in production past the first quarter. The teams that only watch uptime are the teams whose agents quietly degrade until someone notices the business impact, usually too late to fix without a redeployment.


